Data Modeling Solutions
Turn technical jargon into business-friendly information using our Data Modeling Solutions
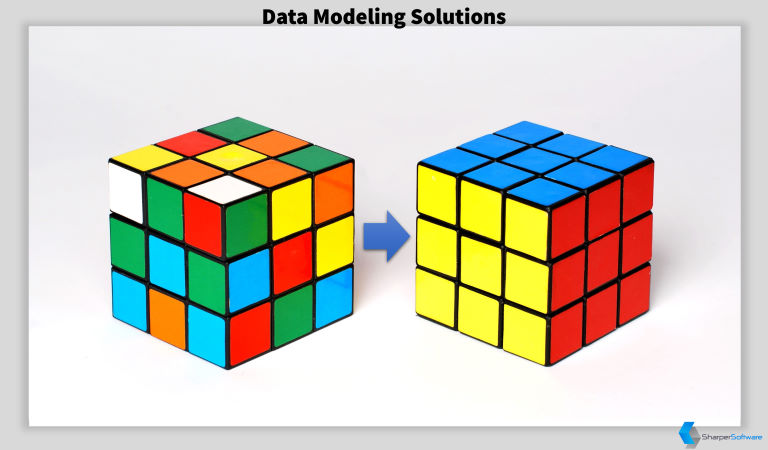
Your data sources are your digital assets. All such sources are usually stored and managed by Information Technology (IT) resources and hence, such data sources contain many technical terms that make sense to IT, but not to business users.
Sharper Services provides an offering whereby such technical jargon is turned into business-friendly information.
IT calls it metadata, Sharper Software calls it the Data Model. We look at it as our data heaven.
Data Modeling Tasks
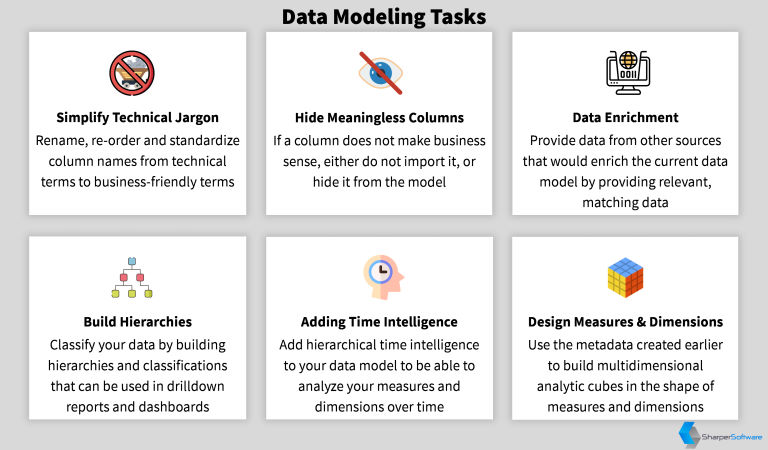
Simplify Technical Jargon
Rename and re-order columns in such a way that business users are able to pick the field they are looking for with relative ease. We may use column names that are in your local language to make it even easier to work with.
Hide meaningless columns
If a column does not have a business impact or meaning, we either do not import it into the Data Model, or we hide these columns. This improves the usability of the Data Model and eliminates ambiguities.
Data Enrichment
By adding computed columns to your tables, or by importing augmenting data, it is possible to enrich your Data Model and help you with further insights. For example, if your data includes airport names and codes, we can augment this data with the GPS location of the airport, which was not part of your original data. This enrichment would allow your users to visualize your metrics on a map view, where the airport's longitude and latitude appear.
Build Hierarchies
By building hierarchies of your data in the Data Model, we will enable you to view your metrics summarized on each level of the hierarchy. This also enabled drill-down features in tools like Power BI.
Adding Time Intelligence
Your data may have more than one date column, when in the real world, date and time and unique. Here, we add one or more hierarchical time intelligence into the Data Model. This enables you to analyze your metrics over a time span such as year, semester, quarter, month, week and day. If you'd like to analyze your metrics based on both Gregorian as well as Hijri calendars, we can help you achieve this.
Design Measures and Dimensions
Once all metadata is ready, we can develop measures and dimensions into a multidimensional analytical cube. This cube can then be sliced and diced to find the information the end user wishes to see.
Gallery


Improved Processes
With tools that help you identify the weak areas of your business, you can improve your business processes.
Informed Decisions
Rather than relying on your intuition, use information you collected from the BI Platform to make informed decisions based on facts.
Competitive Advantage
Gain market share over your competition by better understanding your business. Develop customer-focused products and solutions.
Improved Planning
Use facts collected by your BI Platform to perform more accurate planning and performance management.
Business Alignment
By articulating your business objectives, goals and targets to concerned personnel, you align your resources better together.
New Insights
Find new information about your business. This information would never have surfaced in the absence of a BI Platform.